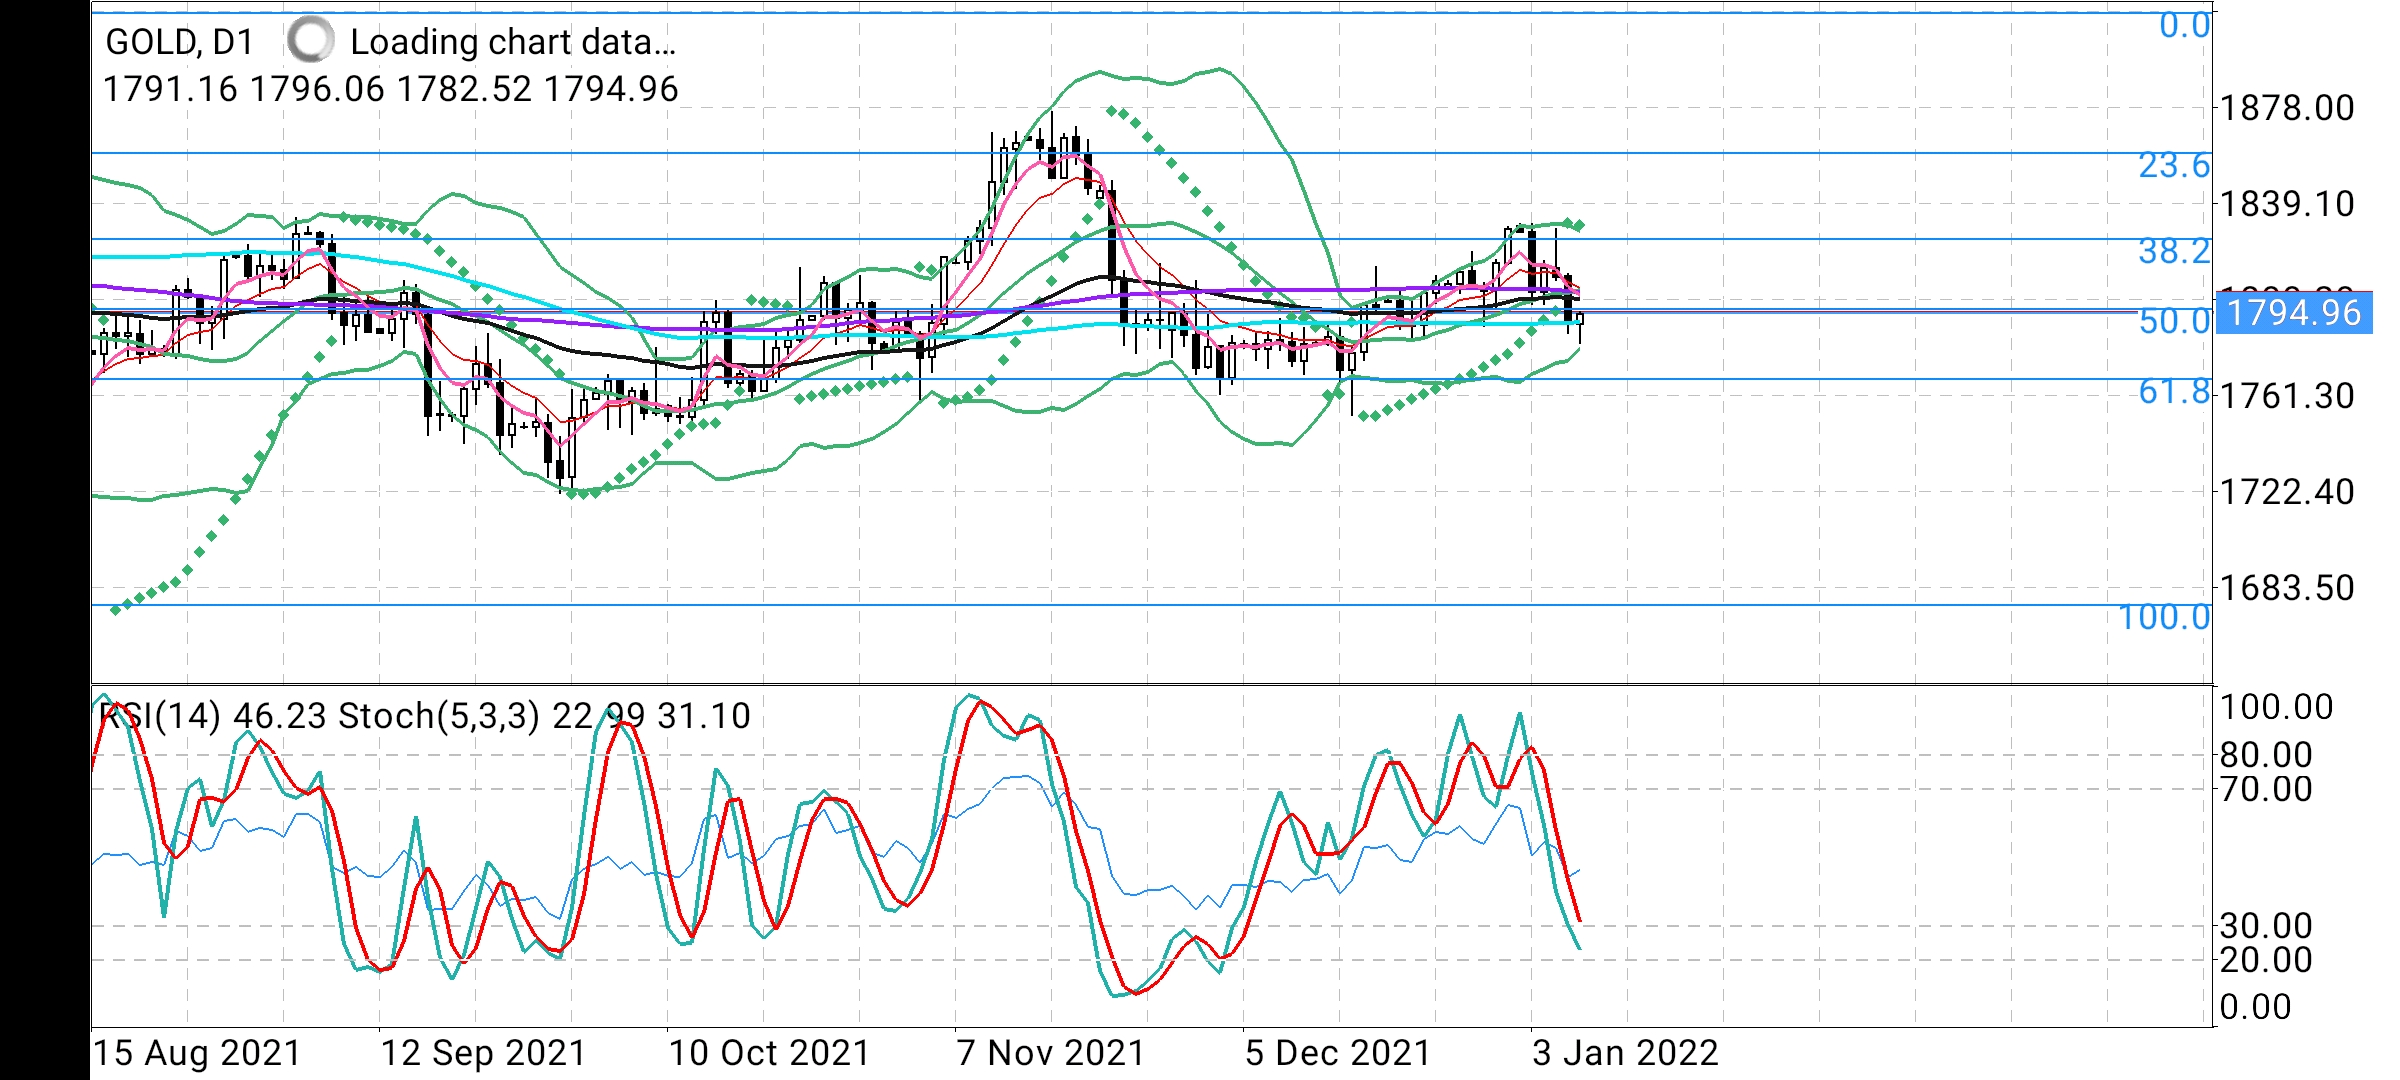
Gold price action suggests that the metal has been trading with a bearish bias after bears taken control and rejected the up move at 1831.
Double top formation is clearly visible on 4 Hour time frame chart and as a result Gold fell sharp to test 1782 shedding almost $50 from swing high of 1831
Fibonacci retracement from 1753 major low and 1831 recent high indicates that the mean level of 50% at 1792 and another 50% Fibonacci level of retracement measured from 1678 low of March 2021 to 1916 high of May 2021 at 1798 are critical for further price behavior.
Sustained move above 1792-1798 can extend recovery in Gold to 1825 while weakness below 1798-1792 may erase any gains and extend the decline to 1783 and 1771 which is acceleration point to major support 1753
#forextrading #forexsignals #bitcoin #forexlifestyle #trading #money #investment #trader #cryptocurrency #binaryoptions #forexmarket #forexlife #entrepreneur #forexprofit #forexsignal #forexeducation #business #binary #investing #crypto #bitcoinmining #forextrade #blockchain #forexmoney #invest #fx #investor #gold