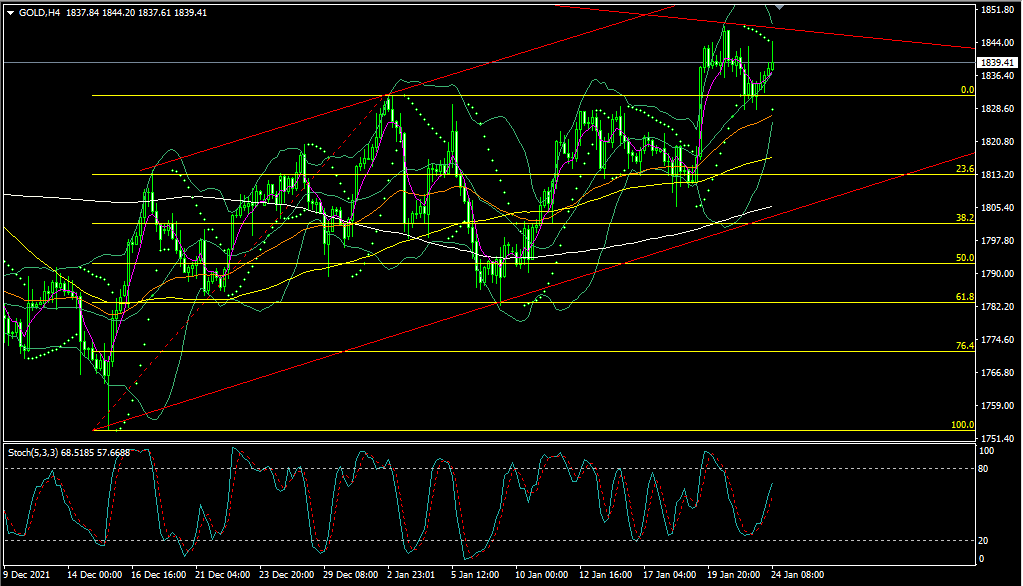
Gold price action throughout last week showed solidarity holding above 1828 which is near 38.2% Fibonacci level of 1825 and been supported by 50 EMA on 4 Hour time frame chart which also created a double bottom formation that pushed prices up for retest of 1844
Intraday profit booking by retail traders may cause some technical correction taking prices to test 1837 and 1830. Prices can further weaken in correction towards 1825 and 1818 which is middle Bollinger Band on Daily chart. If Fed announces hawkish measures, weak sentiments can extend selling to 50 Day EMA 1811 and even 1799 which is a critical confluence area of 100 and 200 Day SMA as well as close to 50% Fibonacci level 1796
Sice the mid term is bullish, Buyers can come in at the test of these value area of 1825,1818 and 1799
Daily close followed by weekly close below 1796 may turn Gold mid term trend to bearish leading to deeper corrections towards retest of 1753, 1720 and 1680