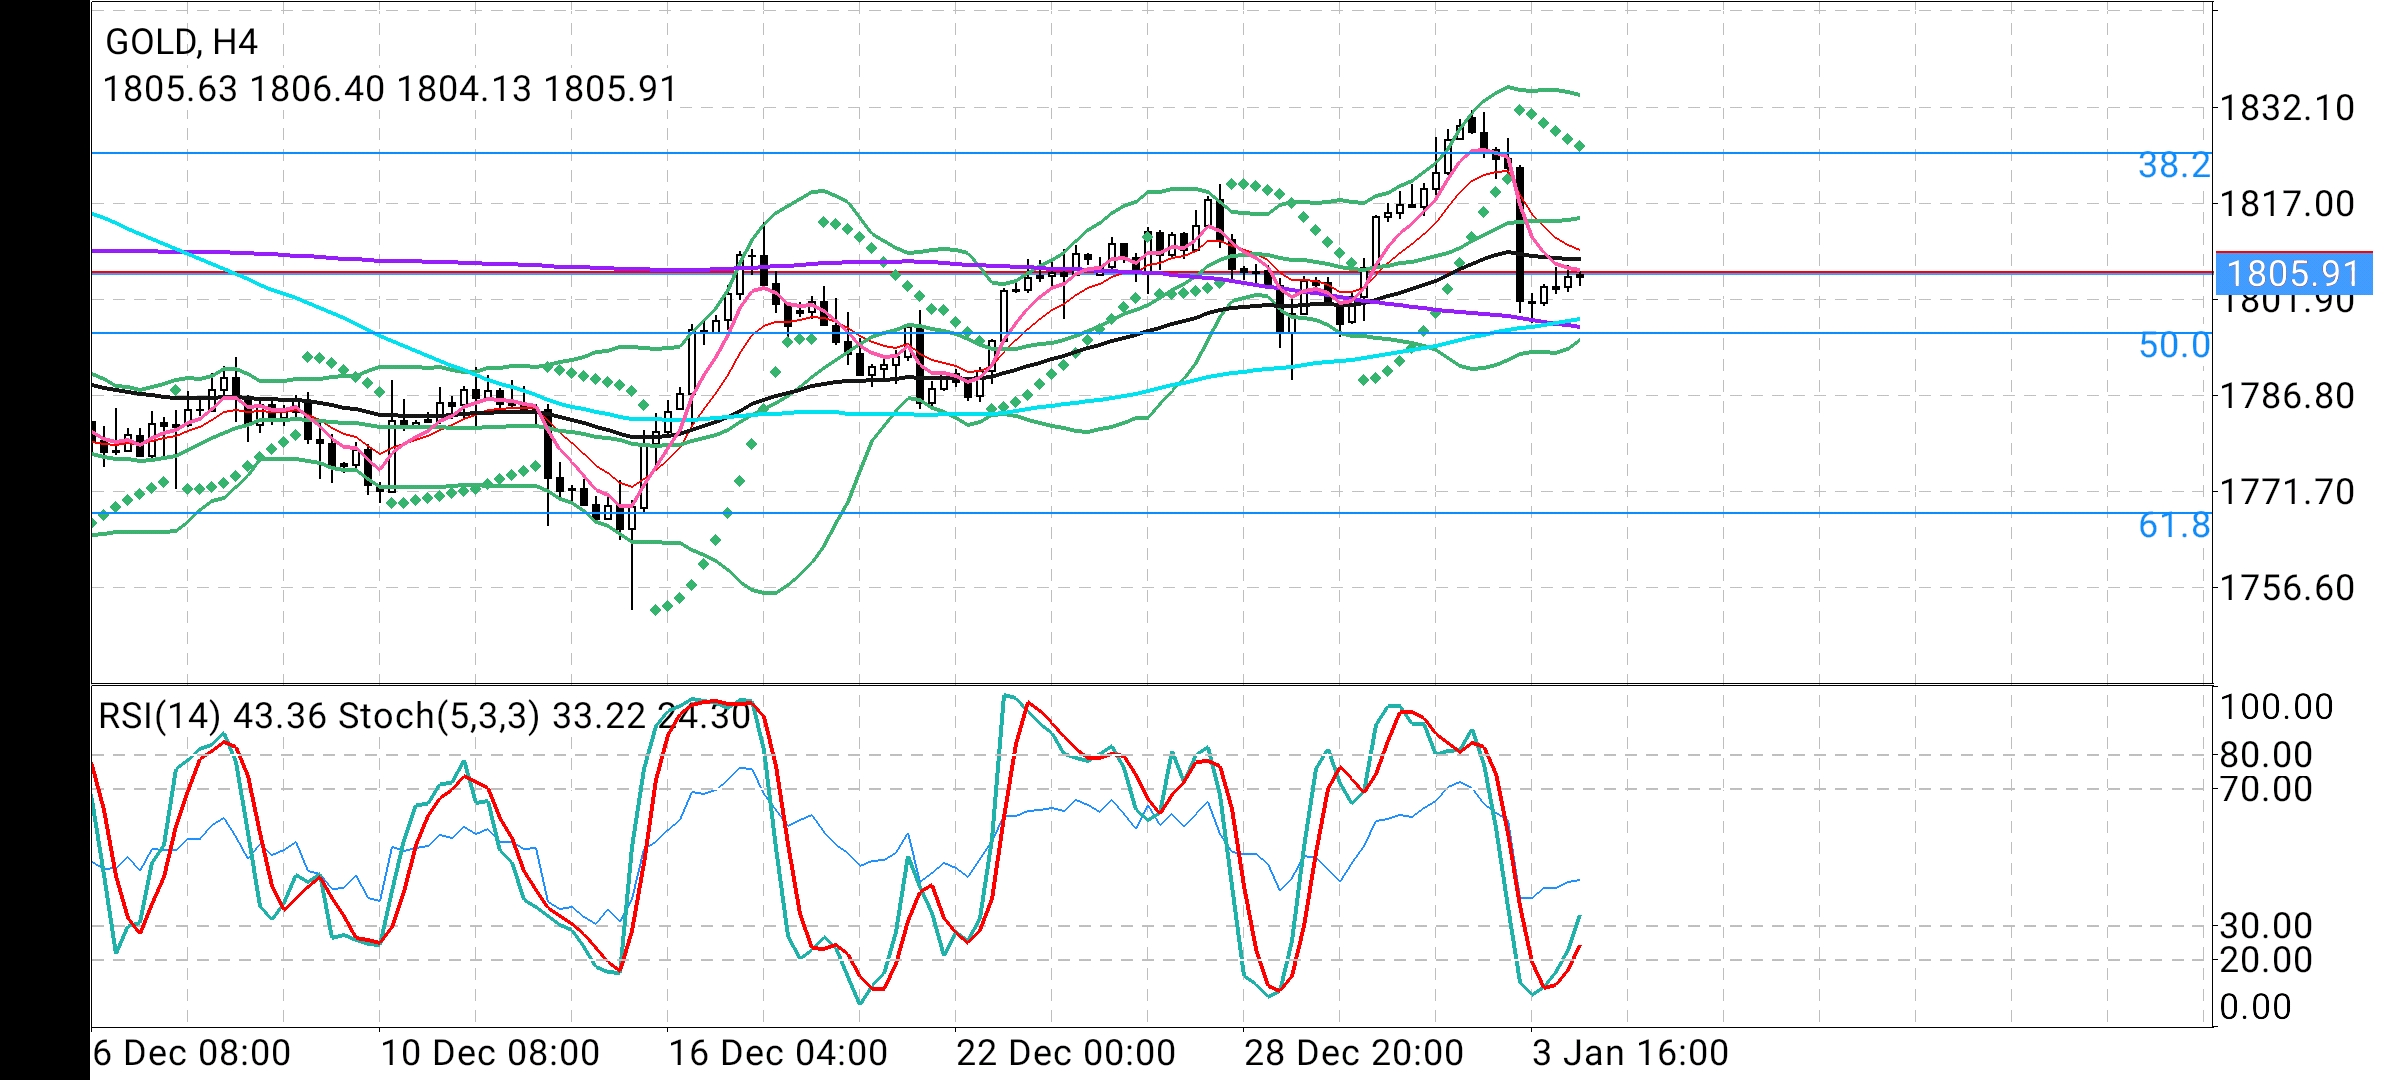
Gold settled for the week, month and year at 1830 after testing 1832.
Cautious traders preferred booking profits and sell off pushed the metal down to critical support 1798.
This is a critical support for two reasons.
1. It coincides with 50%Fibonacci level of retracement measured from 1678 low of March 2021 to 1916 high of May 2021.
2. This is also a strong confluence zone for 50 week EMA, 100 week SMA and middle Bollinger Band on weekly chart.
Now as long as Gold holds above 200 Day SMA 1804.70 we may expect to see the price advancing towards 5 and 10 Day EMAs 1810 & 1811 and retest 1825 which is 38.2% fibonacci level.
Decisive break above the swing top 1832 gives 1860 as next target which is 23.6% fibonacci level.
On the flip side, weakness below 1798 may prompt a quick test of 100 Day SMA 1790 which is likely to arrest the fall on short term. Consistent weakness below 100 Day SMA 1790 may extend bearish conditions and expose Gold to 1768 which is 61.8% fibonacci level