Gold proved to be a great bet for 'Buy the dips' style traders. Tuesday Gold retested 1798 critical support where buyers resurfaced triggering the up move once again and today since early asian trading hours Gold has been trading firmly with bullish bias and tested 1820
The metal is sustaining above 50% fibonacci level of 1831.65 -1798.23 retracement which is pivotal for minor trend which continues to be bullish.
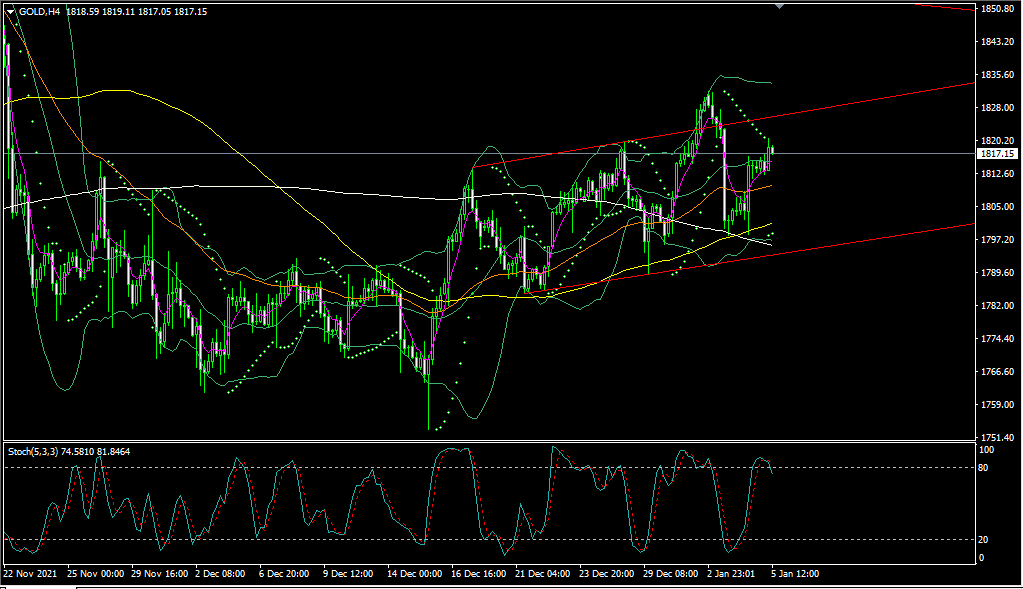
Stochastic reading of 75/82 on 4 hour chart may cause some distribution of momentum due to negative overlap in stochastics resulting in some sideways to down move on intraday basis and prices may correct to 1815 (50% fibonacci level) , next 1810 which is 50 period EMA on 4 hour chart. In case selling accelerates, Gold may test 100 SMA on 4 hour chart at 1801
Since the short term trend is up, traders may resuface to open long positions again on test of these value areas and prices may rebound to resume the rally which targets 1825 - 1832 - 1843 - 1851 -1860
On the flip side, weakness may start if prices break below 1798 with 1790 as next immediate downside target.