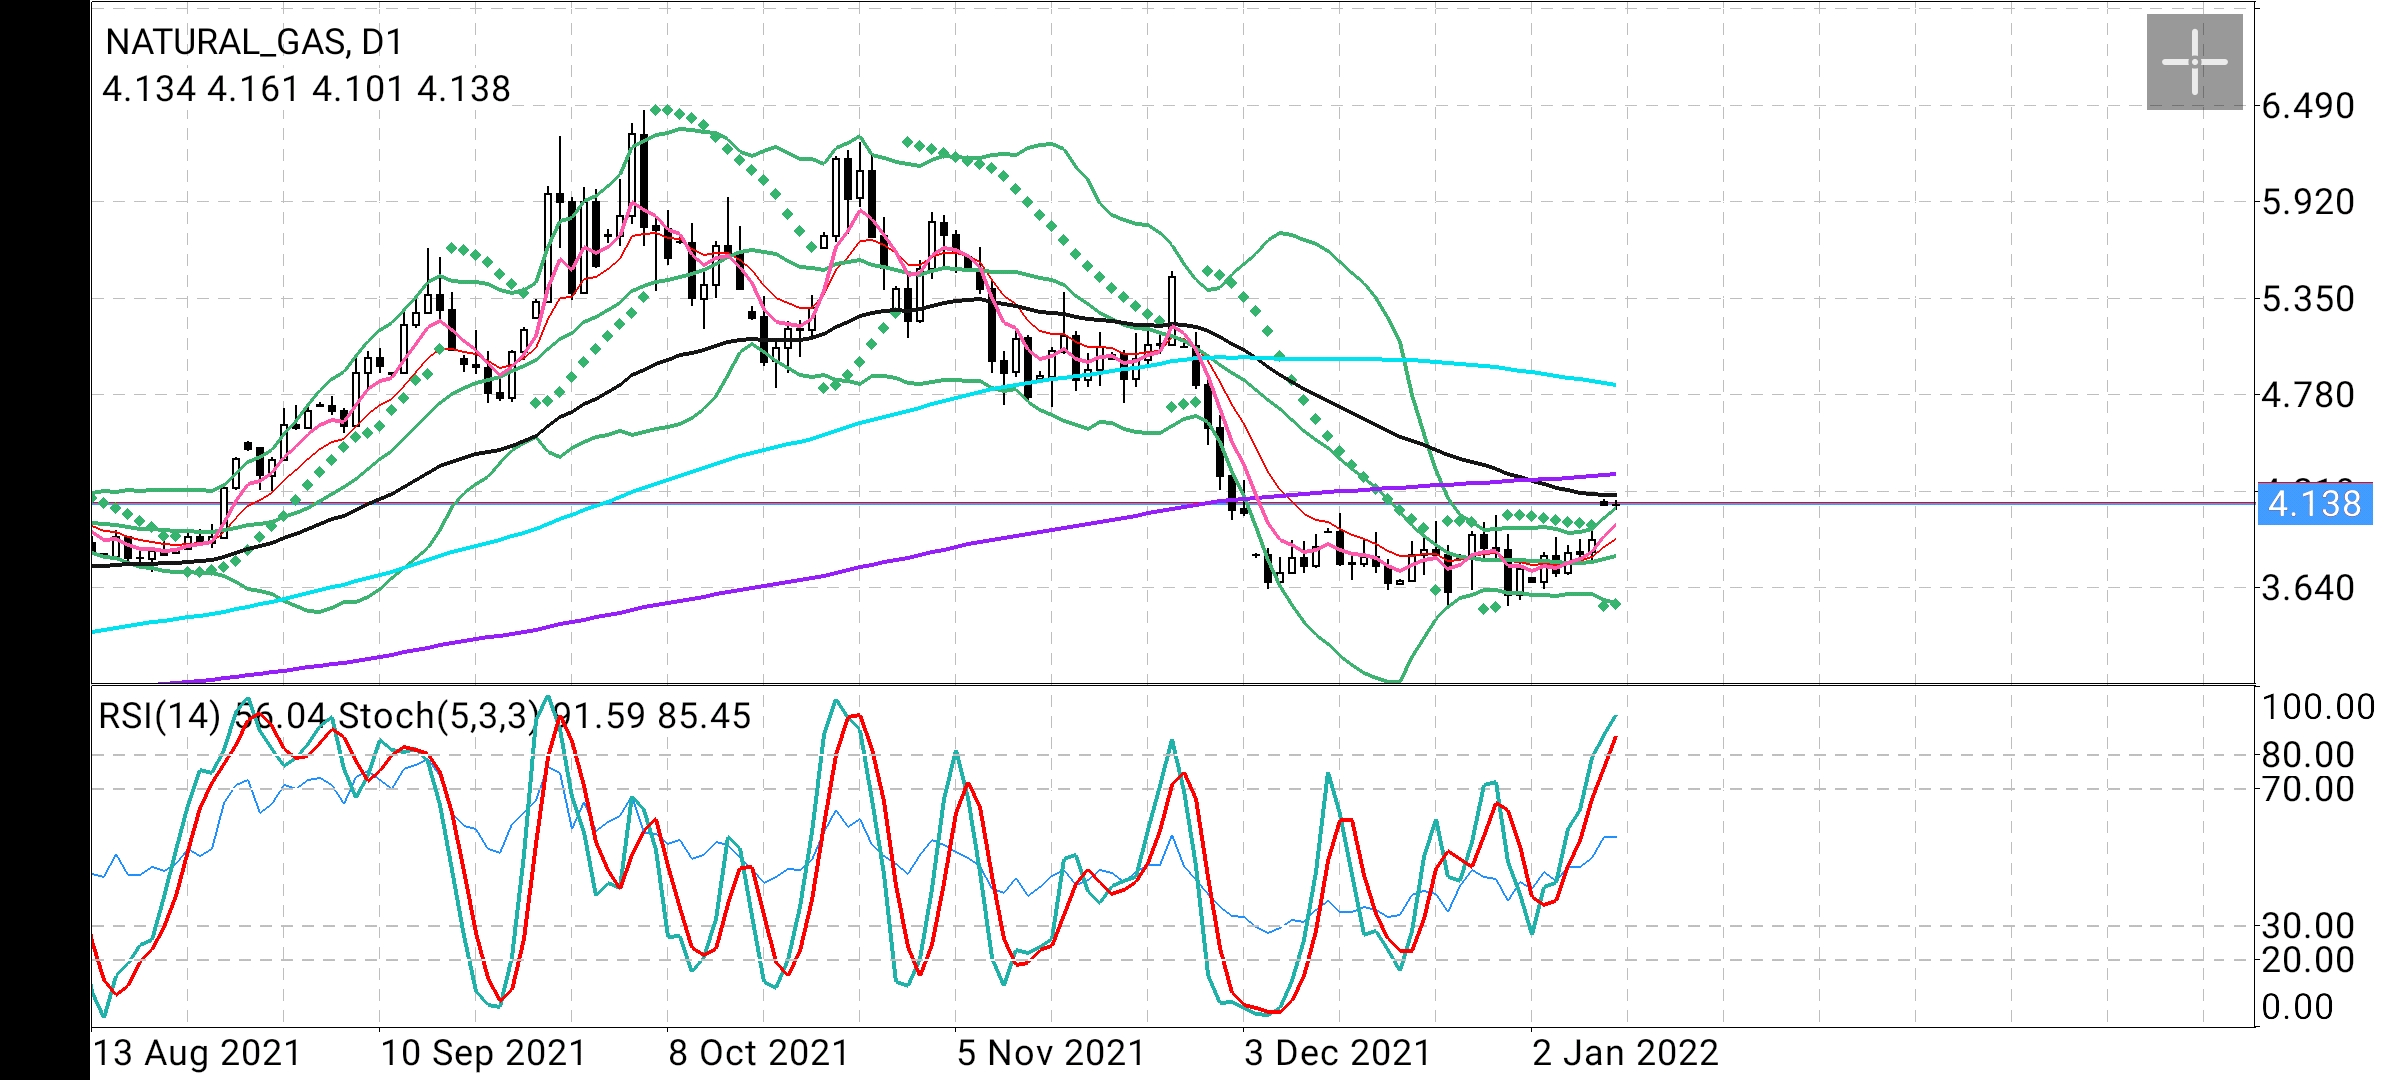
Natural Gas opened the week with a run away gap from Friday's high of 3.976 and tested high of 4.167
Prices are trading above the upper Bollinger Band on Daily chart.
50 Day EMA 4.188 is immediate resistance followed by 200 Day SMA 4.311
Nat Gas is likely to witness correction in order to fill the gap resulting in prices testing 5 Day EMA 4.010 and 10 Day EMA 3.928 on the way while middle Bollinger Band 3.830 controls the up move in the event of correction.
Short term outlook : Nat Gas prices are likely to trade in the range of 4.310 - 3.830
#forextrading #forexsignals #workfromhome #makemoneyonline #Gold #Silver #trading #Palladium #Platinum #naturalgas#CrudeOil #Metatrader