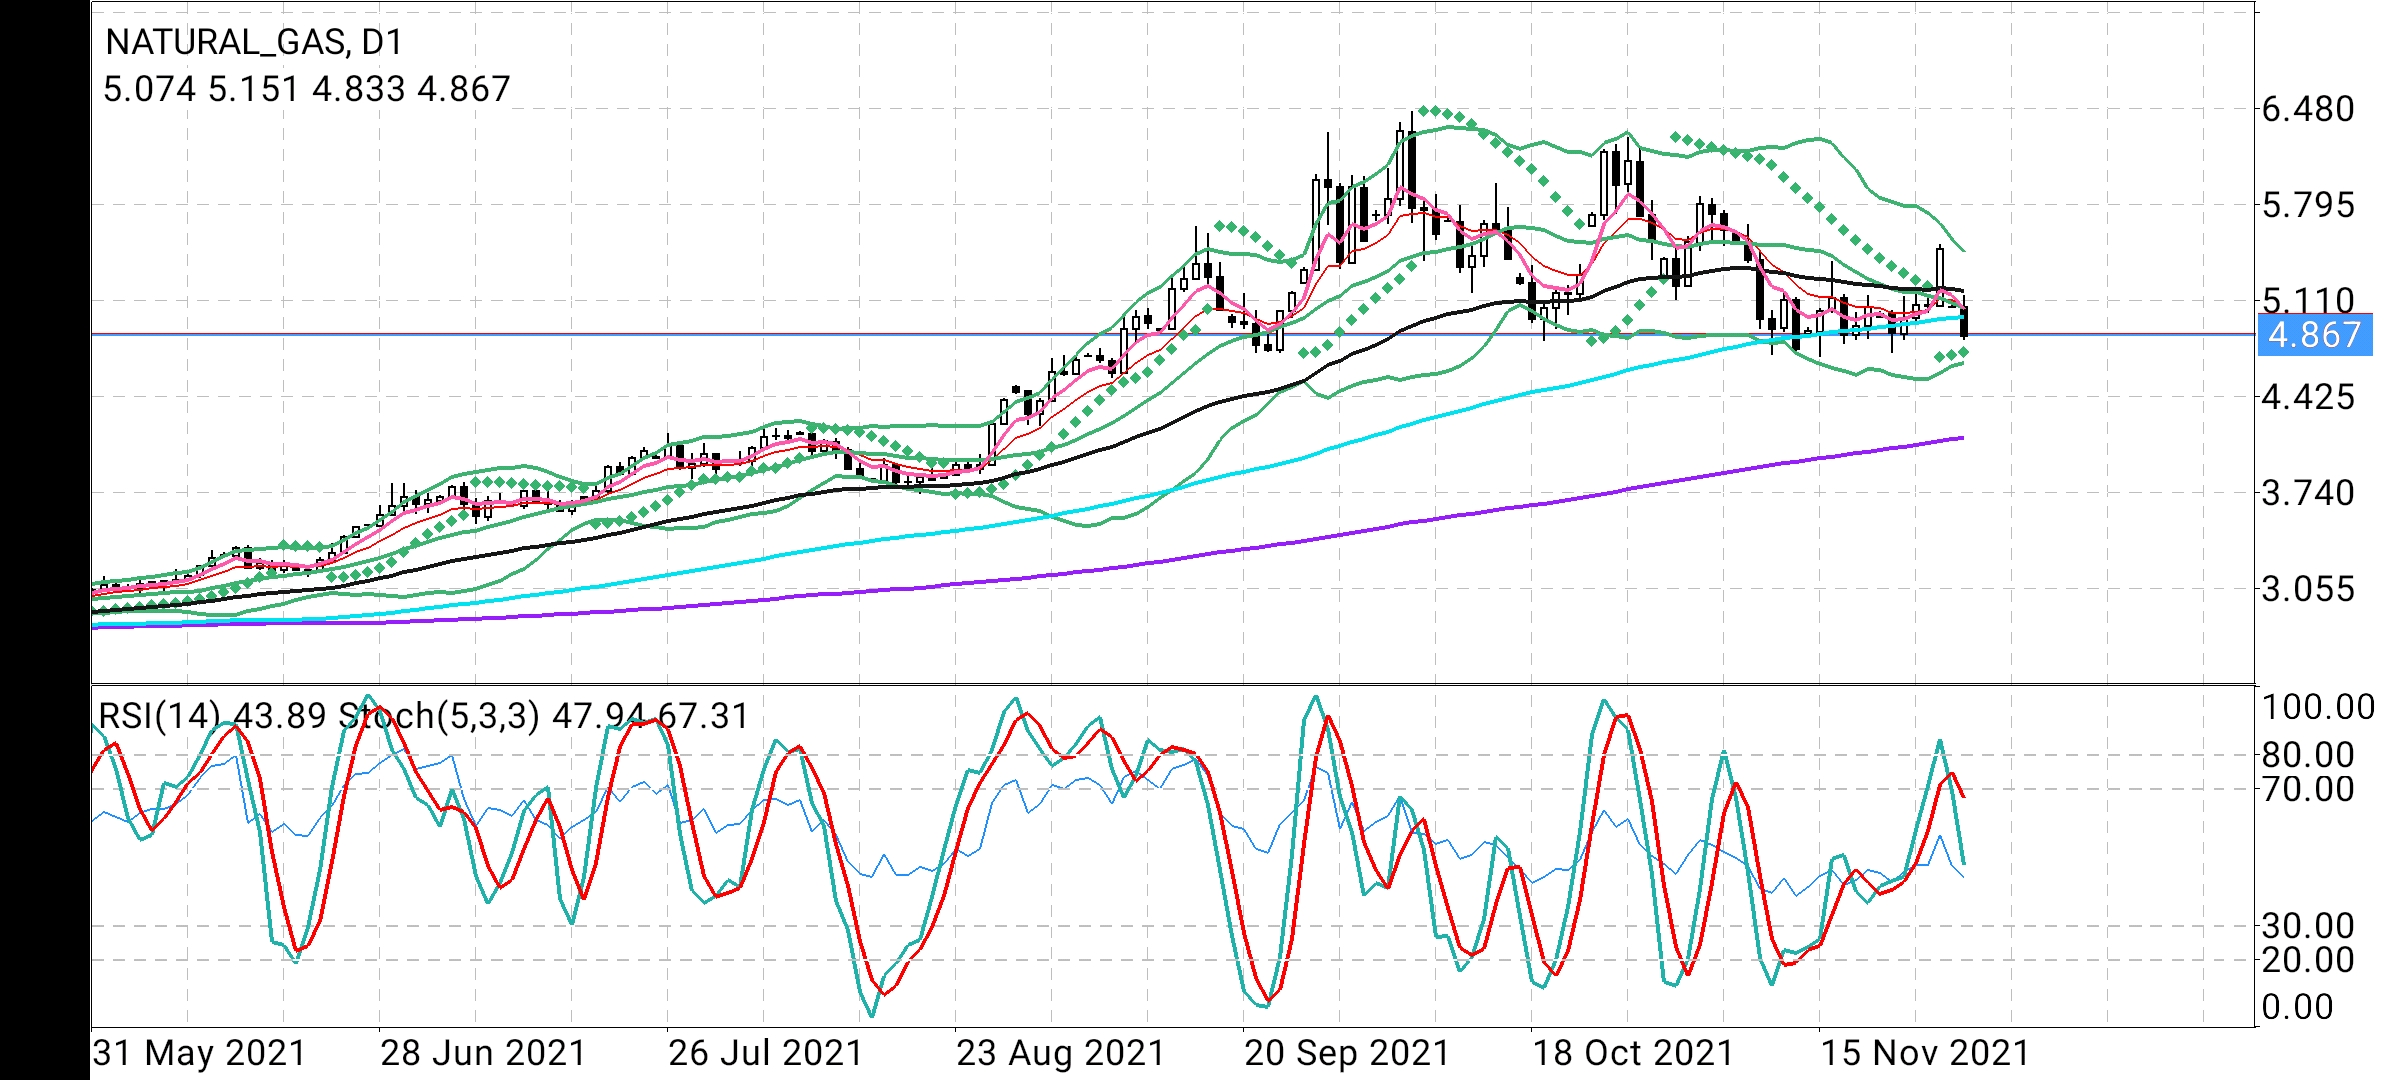
Daily chart shows clear and sharp break below 50 EMA 5.182 and 100 SMA 4.997 testing Intraday low of 4.833
Stochastic fast signal line reading 48 crosses below slow stochastic line reading 67 sending bearish signals.
Trade below 4.73 which is latest swing low will add further affirmation to bearish bias with 4.66 as immediate target.
Sustained move below 4.66 extend downside move to 200 Day SMA 4.13 over an extended period of time.
On the flip side, oversold Stochastic reading on four hours chart may cause some recovery from the lows with potential test of 5.10 and 5.30 extending to 5.50 which is critical acceleration point to upside.