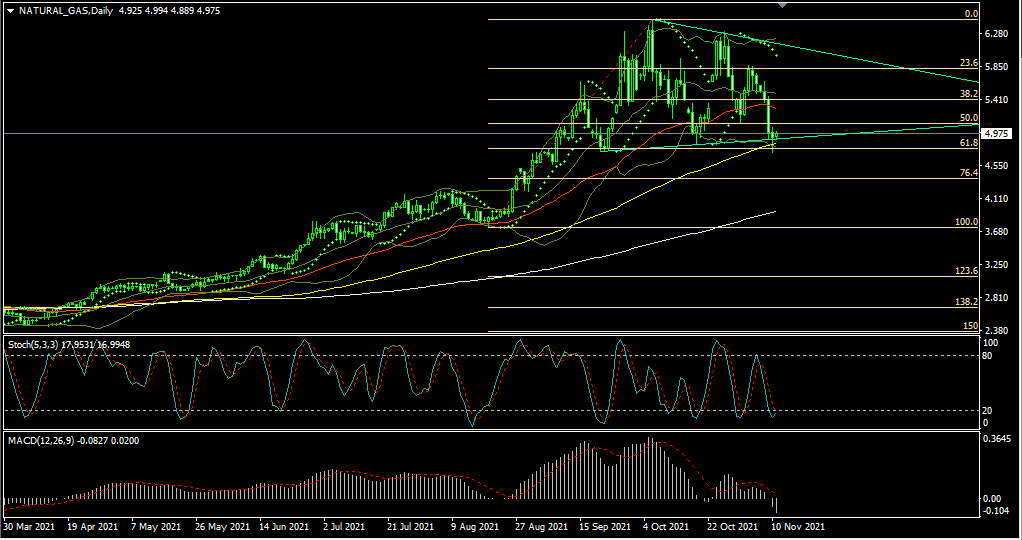
Natural Gas has broken the support trendline of the falling wedge on Wednesday but closed the session above the support line and started the day with recovery signs.
Going further, break below 100 SMA 4.84 on Daily chart can expose Natural Gas prices to a lower fibonacci level of 4.37
Stochastic RSI reads below 20 indicating a possibility of recovery to 5.11 and 5.30 which coincides with the middle Bollinger Band on Daily chart.
Note: Since Natural Gas short Term trend has turned Bearish, the recovery may be short lived.